Hello,
I’m a Fedizen interested in monitoring the dynamics of the Fediverse in terms of centralization/decentralization, so I have performed a small analysis of the Fediverse diversity comparing two time points. I would like to share it with you in case you find it interesting, too. Also, any technical or conceptual feedback will be welcome.
As source data, I have used data acquired by @spla consisting in users and active users (MAU measure) by each known server. From his server mastodont.cat, he has asked to its interacting servers the data mentioned before through their API. Then, he has repeated the query for the known servers of them and so on, ending with up with user and activity information of all connected servers.
Here I show the head of the resulting csv:
| server | users | updated_at | software | alive | mau |
|---|---|---|---|---|---|
dabzyum.masto.host |
4 | 2022-09-03 | mastodon | t | 4 |
grid.p7.de |
1 | 2022-09-03 | mastodon | t | 1 |
mastodon.doufen.org |
2 | 2022-09-03 | mastodon | t | 3 |
uvensys.social |
4 | 2022-09-03 | mastodon | t | 1 |
bihlink.com |
8 | 2022-09-03 | misskey | t | 6 |
I have to say that although software APIs use users term, I will use accounts instead as it is more precise (as @titi suggested).
I have used data acquired the 09-03-2023 (dd-mm-YY) and 17-05-2023, although the idea will be to further extend the analysis.
First, I have constructed the following summary table:
| Data | n Servers | Accounts | Active Accounts | Accounts/Server | Active Accounts/Server |
|---|---|---|---|---|---|
| 2023/03/09 | 8673 | 5046306 | 634561 | 581.8409 | 73.16511 |
| 2023/05/17 | 21099 | 9181234 | 1397236 | 435.1502 | 66.22285 |
First observation is that server, account and active account amount have significantly grown in just two months.
I have to clarify that the active account data refers only to Mastodon servers, as other software don’t necessarily give this information.
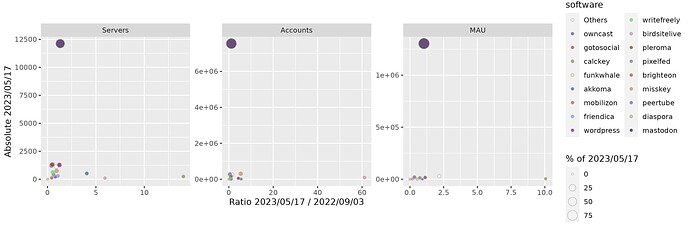
If we take a closer look, even if there are more absolute accounts, the account/server ratio has been reduced (the same with the active account/server ratio), suggesting higher diversity understood as a more evenly distribution of the accounts across Fediverse servers.
However, this ratios are a broad approximation of a diversity analysis. There are global diversity indexes that are used in ecology and immunology fields that may be used in this analysis. In particular, I have used:
- Shannon Index: index to measure evenness of the species in a community. Evenness referrers to how similar are the abundances from different species in that community. In our case, species are the servers. Font in Spanish.
- Simpson Index: diversity measure of a community. Value that goes from 0 to 1 being 1 the highest diversity. Font in Spanish.
Results:
| Data | Shannon - Accounts | Simpson - Accounts | Shannon - Active | Simpson - Active |
|---|---|---|---|---|
| 2023/03/09 | 4.375168 | 0.9401716 | 3.599674 | 0.9095200 |
| 2023/05/17 | 5.176178 | 0.9693727 | 5.022663 | 0.9600337 |
Data shows that both indexes support the idea that there is and increase in diversity and evenness from March to May. This is observed both in total accounts and also in active accounts in Mastodon’s servers.
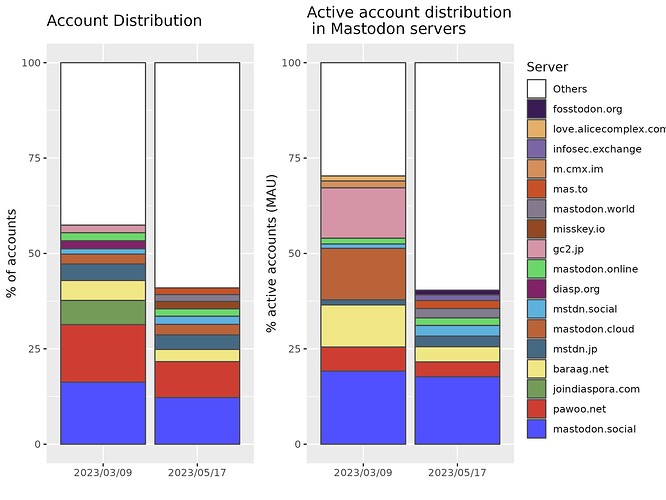
Finally, in order to visualize better this diversity increase, I represent distribution of server abundance stratifying the 10 biggest servers (the rest is under the “Others” label).
Once again, results suggest a rise in diversity as the 10 biggest server contribution to the Fediverse is reduced by more than 10%. So, even if the biggest servers are accumulating more users, it seems that the Fediverse is becoming more decentralized.
I think that those are great news! It would be interesting to follow up this dynamics.
Here is the code in R language used for the analysis.
library(tidyverse)
library(ggsci)


Fedi<-rbind(
  read.csv("FediversData_20230309.csv") %>% select(server, users, mau, alive, software) %>% add_column(Time="2023/03/09"),
  read.csv("FediversData_20230517.csv") %>% select(server, users, mau, alive, software) %>% add_column(Time="2023/05/17")
)
Fedi.users<-Fedi %>%
  filter(alive == "t") %>%
  group_by(Time) %>%
  arrange(desc(users)) %>%
  mutate(server=case_when(
    server %in% server[1:10] ~ server,
    T~"Others"
  )) %>%
  group_by(server, Time) %>%
  summarise(users=sum(users), mau=sum(mau)) %>%
  group_by(Time) %>%
  mutate(users.perc=users*100/sum(users)) %>%
  arrange(desc(users.perc))

Fedi.users.serv<-
  Fedi.users %>% ungroup() %>% arrange(desc(users.perc)) %>% filter(server != "Others") %>% pull(server) %>% unique()

Fedi.mau<-Fedi %>%
  filter(alive == "t" & software == "mastodon") %>%
  group_by(Time) %>%
  arrange(desc(mau)) %>%
  mutate(server=case_when(
    server %in% server[1:10] ~ server,
    T~"Others"
  )) %>%
  group_by(server, Time) %>%
  summarise(users=sum(users), mau=sum(mau, na.rm=T)) %>%
  group_by(Time) %>%
  mutate(mau.perc=mau*100/sum(mau)) %>%
  arrange(desc(mau))

Fedi.mau.serv<- Fedi.mau %>% ungroup() %>% arrange(desc(mau.perc)) %>% filter(server != "Others") %>% pull(server) %>% unique()


Fedi.servers<-unique(c(Fedi.users.serv, Fedi.mau.serv))

Fedi.users$server<-factor(Fedi.users$server, levels=c("Others", rev(Fedi.servers)))
Fedi.mau$server<-factor(Fedi.mau$server, levels=c("Others", rev(Fedi.servers)))

colors<-c("white", pal_igv("default")(length(Fedi.servers)))
names(colors)<-c("Others", Fedi.servers)

g.users<-ggplot(Fedi.users, aes(Time, users.perc, fill=server))+
  geom_bar(stat="identity", color="grey30")+
  scale_fill_manual(values=colors, drop=F)+
  labs(y="% of accounts", title="Account Distribution", fill="Server", x="")

g.mau<-ggplot(Fedi.mau, aes(Time, mau.perc, fill=server))+
  geom_bar(stat="identity", color="grey30")+
  scale_fill_manual(values=colors, drop=F)+
  labs(y="% active accounts (MAU)", title="Active account distribution\n in Mastodon servers", x="")

ggpubr::ggarrange(
  g.users,
  g.mau,
  nrow=1, common.legend = T, legend = "right", align = "h"
)
ggsave("Barres.jpg", width = 8, height = 6)

merge(
  Fedi %>% group_by(Time) %>% summarise(n.servidors=n()),
  Fedi %>% group_by(Time) %>% summarise(comptes=sum(users, na.rm=T), comptes.actius=sum(mau, na.rm=T))
) %>% rename(Data=Time) %>% mutate(`comptes/servidor`=comptes/n.servidors, `actius/servidor`=comptes.actius/n.servidors)

## Diversity analysis

divers<-data.frame(
  "Data"=c("2023/03/09","2023/05/17"),
  ShannonIndex.Comptes=c(vegan::diversity(Fedi %>% filter(Time == "2023/03/09") %>% filter(users >= 0) %>% pull(users), index="shannon"),
    vegan::diversity(Fedi %>% filter(Time == "2023/05/17") %>% filter(users >= 0) %>% pull(users), index="shannon")),
  SimpsonIndex.Comptes=c(vegan::diversity(Fedi %>% filter(Time == "2023/03/09") %>% filter(users >= 0) %>% pull(users), index="simpson"),
    vegan::diversity(Fedi %>% filter(Time == "2023/05/17") %>% filter(users >= 0) %>% pull(users), index="simpson")),
  ShannonIndex.Actius=c(vegan::diversity(Fedi %>% filter(Time == "2023/03/09" & software == "mastodon") %>% filter(mau >= 0) %>% pull(mau), index="shannon"),
                         vegan::diversity(Fedi %>% filter(Time == "2023/05/17"& software == "mastodon") %>% filter(mau >= 0) %>% pull(mau), index="shannon")),
  SimpsonIndex.Actius=c(vegan::diversity(Fedi %>% filter(Time == "2023/03/09"& software == "mastodon") %>% filter(mau >= 0) %>% pull(mau), index="simpson"),
                         vegan::diversity(Fedi %>% filter(Time == "2023/05/17"& software == "mastodon") %>% filter(mau >= 0) %>% pull(mau), index="simpson"))
)
divers
