Analysis of Fediverse Diversity in terms of Decentralization

Hello,

I’m a Fedizen interested in monitoring the dynamics of the Fediverse in terms of centralization/decentralization, so I have performed a small analysis of the Fediverse diversity comparing two time points. I would like to share it with you in case you find it interesting, too. Also, any technical or conceptual feedback will be welcome.

As source data, I have used data acquired by @spla consisting in users and active users (MAU measure) by each known server. From his server mastodont.cat, he has asked to its interacting servers the data mentioned before through their API. Then, he has repeated the query for the known servers of them and so on, ending with up with user and activity information of all connected servers.

Here I show the head of the resulting csv:

server users updated_at software alive mau
dabzyum.masto.host 4 2022-09-03 mastodon t 4
grid.p7.de 1 2022-09-03 mastodon t 1
mastodon.doufen.org 2 2022-09-03 mastodon t 3
uvensys.social 4 2022-09-03 mastodon t 1
bihlink.com 8 2022-09-03 misskey t 6

I have to say that although software APIs use users term, I will use accounts instead as it is more precise (as @titi suggested).

I have used data acquired the 09-03-2023 (dd-mm-YY) and 17-05-2023, although the idea will be to further extend the analysis.

First, I have constructed the following summary table:

Data n Servers Accounts Active Accounts Accounts/Server Active Accounts/Server
2023/03/09 8673 5046306 634561 581.8409 73.16511
2023/05/17 21099 9181234 1397236 435.1502 66.22285

First observation is that server, account and active account amount have significantly grown in just two months.

I have to clarify that the active account data refers only to Mastodon servers, as other software don’t necessarily give this information.

If we take a closer look, even if there are more absolute accounts, the account/server ratio has been reduced (the same with the active account/server ratio), suggesting higher diversity understood as a more evenly distribution of the accounts across Fediverse servers.

However, this ratios are a broad approximation of a diversity analysis. There are global diversity indexes that are used in ecology and immunology fields that may be used in this analysis. In particular, I have used:

  • Shannon Index: index to measure evenness of the species in a community. Evenness referrers to how similar are the abundances from different species in that community. In our case, species are the servers. Font in Spanish.
  • Simpson Index: diversity measure of a community. Value that goes from 0 to 1 being 1 the highest diversity. Font in Spanish.

Results:

Data Shannon - Accounts Simpson - Accounts Shannon - Active Simpson - Active
2023/03/09 4.375168 0.9401716 3.599674 0.9095200
2023/05/17 5.176178 0.9693727 5.022663 0.9600337

Data shows that both indexes support the idea that there is and increase in diversity and evenness from March to May. This is observed both in total accounts and also in active accounts in Mastodon’s servers.

Finally, in order to visualize better this diversity increase, I represent distribution of server abundance stratifying the 10 biggest servers (the rest is under the “Others” label).

Once again, results suggest a rise in diversity as the 10 biggest server contribution to the Fediverse is reduced by more than 10%. So, even if the biggest servers are accumulating more users, it seems that the Fediverse is becoming more decentralized.

I think that those are great news! It would be interesting to follow up this dynamics.

Here is the code in R language used for the analysis.


library(tidyverse)
library(ggsci)


Fedi<-rbind(
  read.csv("FediversData_20230309.csv") %>% select(server, users, mau, alive, software) %>% add_column(Time="2023/03/09"),
  read.csv("FediversData_20230517.csv") %>% select(server, users, mau, alive, software) %>% add_column(Time="2023/05/17")
)
Fedi.users<-Fedi %>% 
  filter(alive == "t") %>% 
  group_by(Time) %>% 
  arrange(desc(users)) %>% 
  mutate(server=case_when(
    server %in% server[1:10] ~ server,
    T~"Others"
  )) %>% 
  group_by(server, Time) %>% 
  summarise(users=sum(users), mau=sum(mau)) %>% 
  group_by(Time) %>% 
  mutate(users.perc=users*100/sum(users)) %>% 
  arrange(desc(users.perc)) 

Fedi.users.serv<-
  Fedi.users %>% ungroup() %>% arrange(desc(users.perc)) %>% filter(server != "Others") %>% pull(server) %>% unique()

Fedi.mau<-Fedi %>% 
  filter(alive == "t" & software == "mastodon") %>% 
  group_by(Time) %>% 
  arrange(desc(mau)) %>% 
  mutate(server=case_when(
    server %in% server[1:10] ~ server,
    T~"Others"
  )) %>% 
  group_by(server, Time) %>% 
  summarise(users=sum(users), mau=sum(mau, na.rm=T)) %>% 
  group_by(Time) %>% 
  mutate(mau.perc=mau*100/sum(mau)) %>% 
  arrange(desc(mau)) 

Fedi.mau.serv<- Fedi.mau %>% ungroup() %>% arrange(desc(mau.perc)) %>% filter(server != "Others") %>% pull(server) %>% unique()


Fedi.servers<-unique(c(Fedi.users.serv, Fedi.mau.serv))

Fedi.users$server<-factor(Fedi.users$server, levels=c("Others", rev(Fedi.servers)))
Fedi.mau$server<-factor(Fedi.mau$server, levels=c("Others", rev(Fedi.servers)))

colors<-c("white", pal_igv("default")(length(Fedi.servers)))
names(colors)<-c("Others", Fedi.servers)

g.users<-ggplot(Fedi.users, aes(Time, users.perc, fill=server))+
  geom_bar(stat="identity", color="grey30")+
  scale_fill_manual(values=colors, drop=F)+
  labs(y="% of accounts", title="Account Distribution", fill="Server", x="")

g.mau<-ggplot(Fedi.mau, aes(Time, mau.perc, fill=server))+
  geom_bar(stat="identity", color="grey30")+
  scale_fill_manual(values=colors, drop=F)+
  labs(y="% active accounts (MAU)", title="Active account distribution\n in Mastodon servers", x="")

ggpubr::ggarrange(
  g.users,
  g.mau,
  nrow=1, common.legend = T, legend = "right", align = "h"
)
ggsave("Barres.jpg", width = 8, height = 6)

merge(
  Fedi %>% group_by(Time) %>% summarise(n.servidors=n()),
  Fedi %>% group_by(Time) %>% summarise(comptes=sum(users, na.rm=T), comptes.actius=sum(mau, na.rm=T))
) %>% rename(Data=Time) %>% mutate(`comptes/servidor`=comptes/n.servidors, `actius/servidor`=comptes.actius/n.servidors)

## Diversity analysis

divers<-data.frame(
  "Data"=c("2023/03/09","2023/05/17"),
  ShannonIndex.Comptes=c(vegan::diversity(Fedi %>% filter(Time == "2023/03/09") %>% filter(users >= 0) %>% pull(users), index="shannon"),
    vegan::diversity(Fedi %>% filter(Time == "2023/05/17") %>% filter(users >= 0) %>% pull(users), index="shannon")),
  SimpsonIndex.Comptes=c(vegan::diversity(Fedi %>% filter(Time == "2023/03/09") %>% filter(users >= 0) %>% pull(users), index="simpson"),
    vegan::diversity(Fedi %>% filter(Time == "2023/05/17") %>% filter(users >= 0) %>% pull(users), index="simpson")),
  ShannonIndex.Actius=c(vegan::diversity(Fedi %>% filter(Time == "2023/03/09" & software == "mastodon") %>% filter(mau >= 0) %>% pull(mau), index="shannon"),
                         vegan::diversity(Fedi %>% filter(Time == "2023/05/17"& software == "mastodon") %>% filter(mau >= 0) %>% pull(mau), index="shannon")),
  SimpsonIndex.Actius=c(vegan::diversity(Fedi %>% filter(Time == "2023/03/09"& software == "mastodon") %>% filter(mau >= 0) %>% pull(mau), index="simpson"),
                         vegan::diversity(Fedi %>% filter(Time == "2023/05/17"& software == "mastodon") %>% filter(mau >= 0) %>% pull(mau), index="simpson"))
)
divers
9 Likes

Thanks for sharing this, @marcelcosta, this is absolutely fabulous!

1 Like

Nice stattage. 1.4M is less than I thought for actives.

Any idea what % are bots?

1 Like

No idea. I don’t think this is something you can get via API, so I cannot analyze it like this. Maybe each admin can obtain this info from its server, but it’s difficult to get the “global picture”.

2 Likes

Hello,

I am a bit embarrassed to say that I misunderstood my own date time of the first time point. So the comparison don’t start at 9 of March of 2023 but in 3 of September of 2022!

So sorry. I don’t know if I can edit the content of the post…

Still, conclusions remain the same and they are more valuable, as the comparison start before big October22 wave.

Thanks for sharing, definitely interested in these facets!

1 Like

Hello!

Following a previous analysis (!it’s in catalan language!) and recovering the interest on the Fediverse, I’ve extended my analysis focusing in software diversity in that case.

The two time points analyzed are from September 2022 and May 2023. In the initial analysis above there is a mistake.

The dataset used is obtained using script based on this code written by @spla.

Before getting into the analysis itself, I want to state that the active users measure is somehow confusing. Some servers show higher amount of active users than total users! And the other servers may also have overestimating its activity. While it may have a technical explanation, it makes interpretation a bit more difficult.

Absolute dynamics by software

In this first plot, I represent the dynamics in terms of servers suing the software, absolute accounts of servers using it and active accounts on those servers. I’m showing any software reaching 1% in any of the three measures and the rest are grouped in the “Others” category (otherwise the amount would be overwhelming).

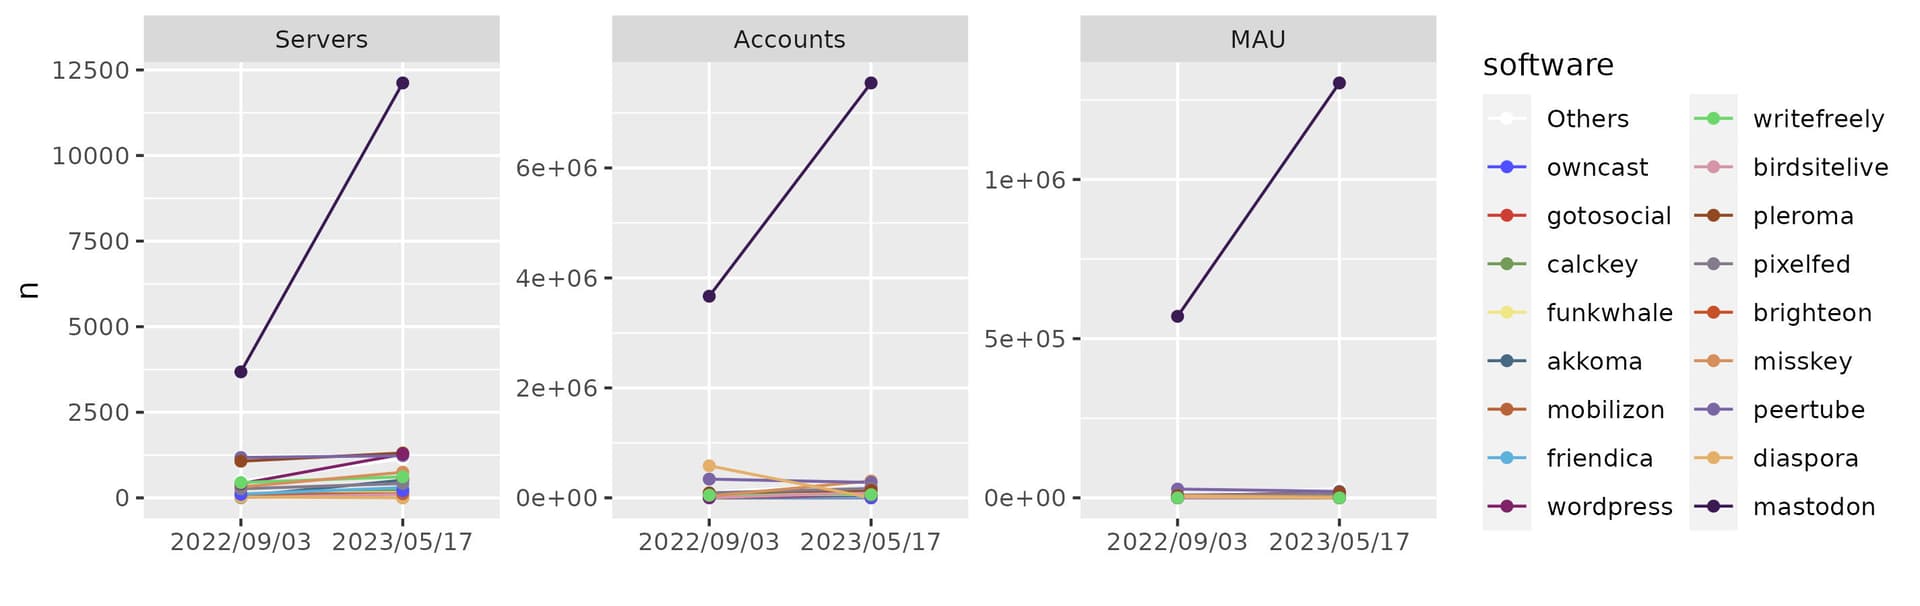
As it can be observed, there is a huge increase for mastodon software in the three measures. In May, there are 4 times the amount of servers using it there were in September 2022. And active accounts have increased 3 times!

The variation in other software is less evident, so I have excluded mastodon from the analysis in order to zoom on them.

From this results, more or less all software show an increase in the servers amount, specially wordpress, akkoma and also the Others category.

In terms of total accounts, misskey show a significant increase and we can see a decrease in peertube accounts and a big decrease for diaspora. This is due to the closing of the very big instance joindiaspora.com.

Focusing in active accounts, I highlight pleroma and pixelfed increase, in addition to the Others category.

Relative distribution of software

Next analysis represents the software distribution related to the three measures.

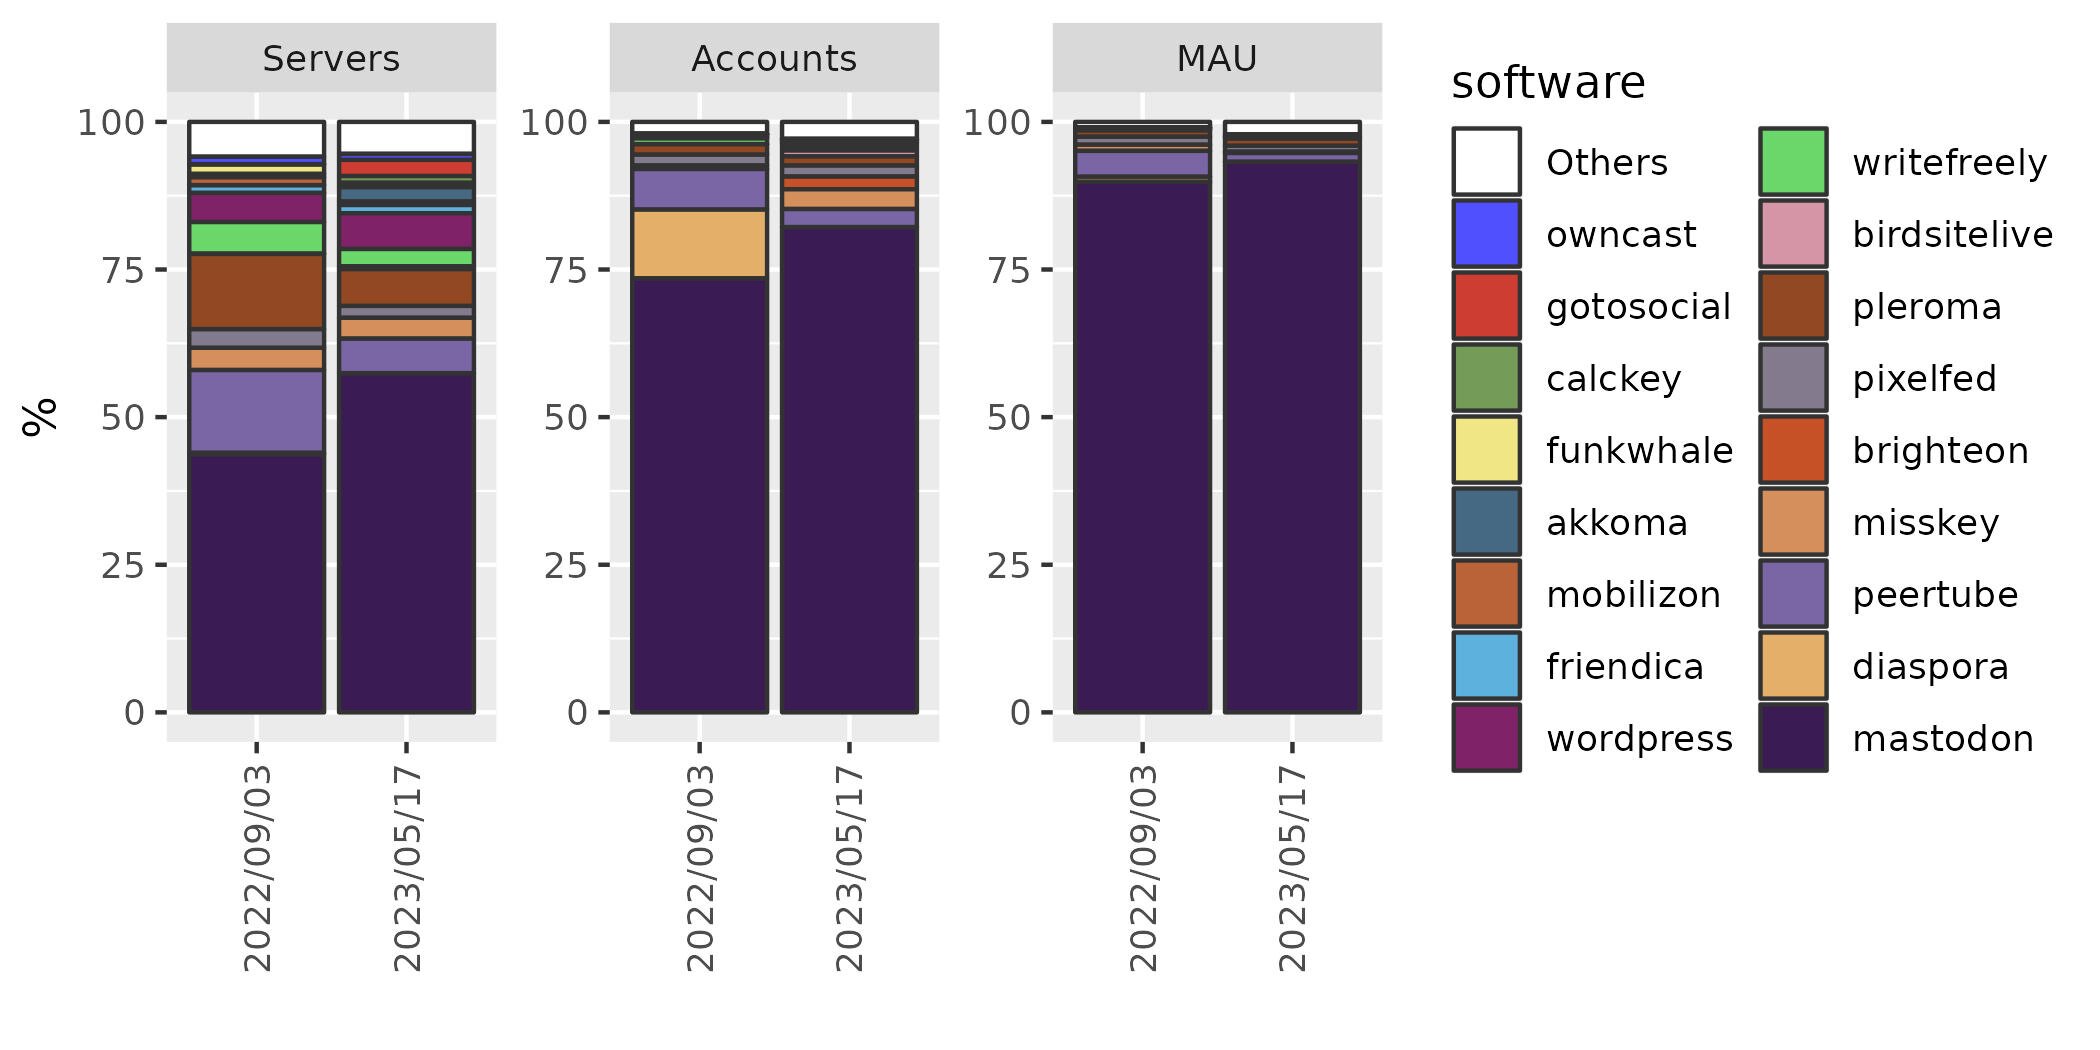
We can see that mastodon was the most used software in September, although it didn’t reach the 50%. This dominance has increased in the last 6 months becoming the majority of servers.

Mastodon dominance much clearer in terms of total and active accounts.

Software variation in relative distribution

In order to visualize better the variation in each software contribution to the Fediverse I have plotted the difference in percentage between the two time points (x axis) by each software (y axis). Size of the points represent percentage in each measure in May time point.

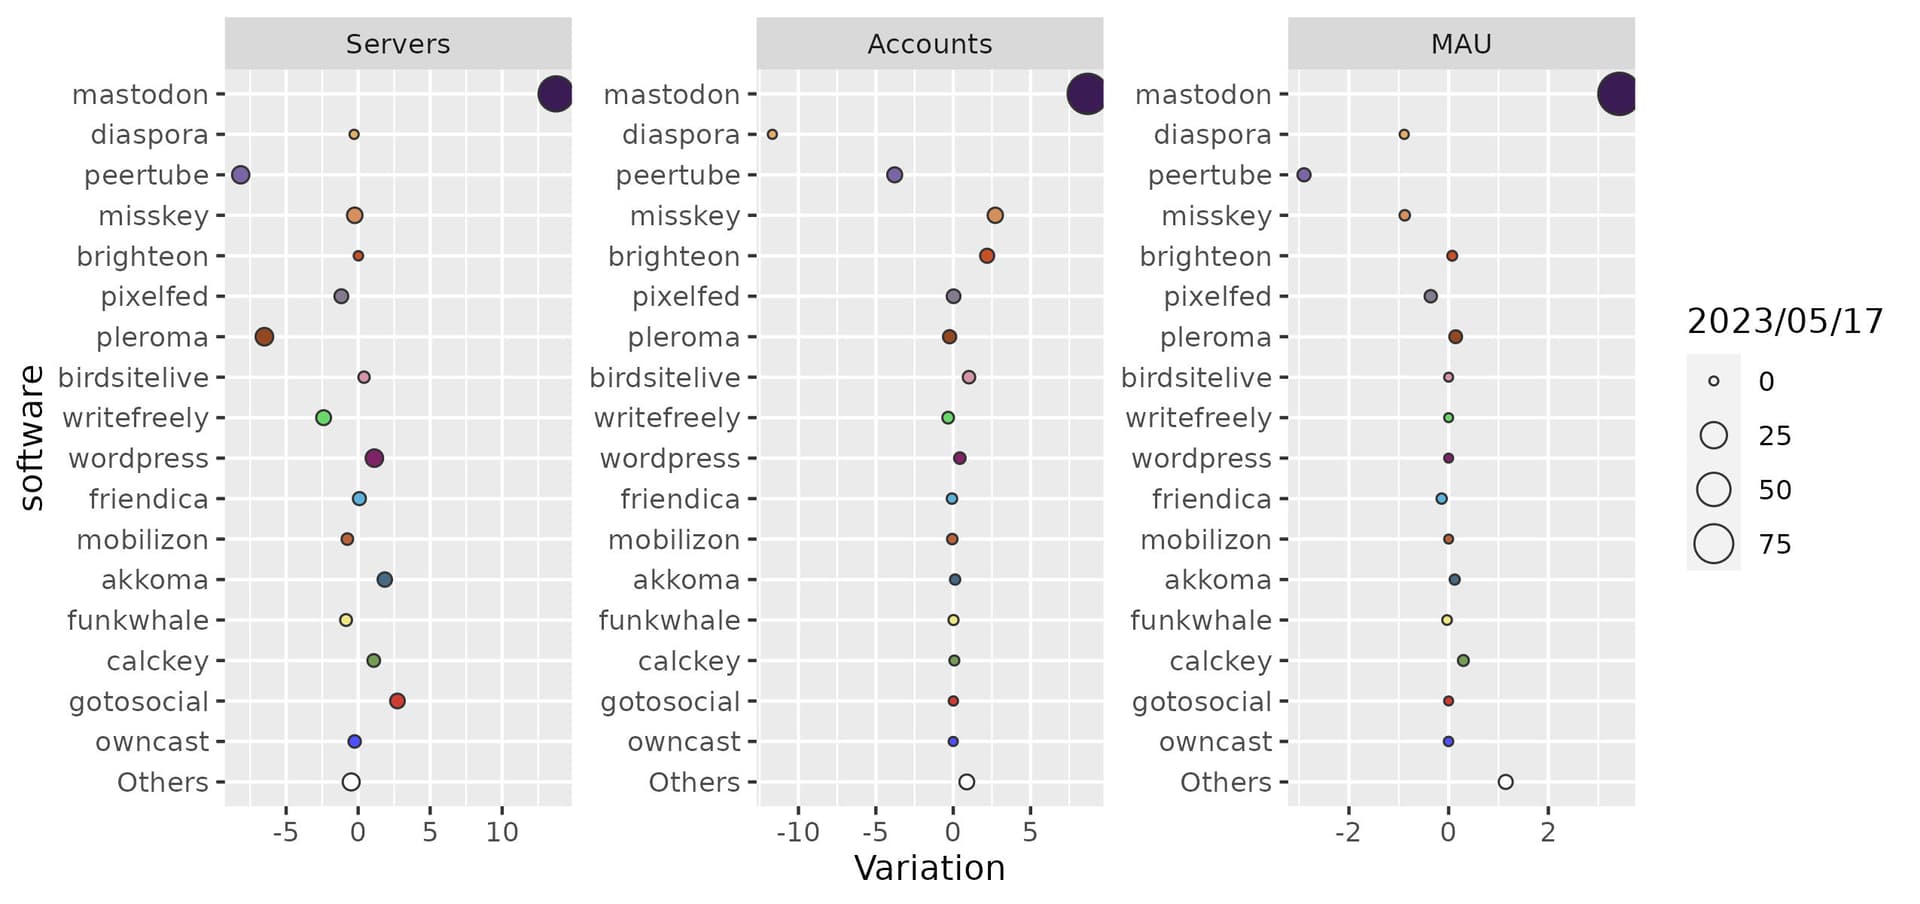
As we could see in the previous plot, the increase in the amount of servers using mastodon is significantly higher than the rest, reaching a variation of more than 10%. In addition, gotosocial, akkoma, calckey, wordpress and birdsitelive also show an increase in percentage.

In terms of total accounts, misskey, brighteon and birdsitelive join mastodon in showing a positive variation. Diaspora and peertube have clearly step back in representation. The last also show a clear reduction in active accounts, where the active users not using any of the listed softwares stands up.

Software growth

In order to focus in the increase taking the absolute values for the three measures I have plotted the Ratio between the two time points (x axis) versus the absolute measure in May (y axis). Point size represents the percentage in May.

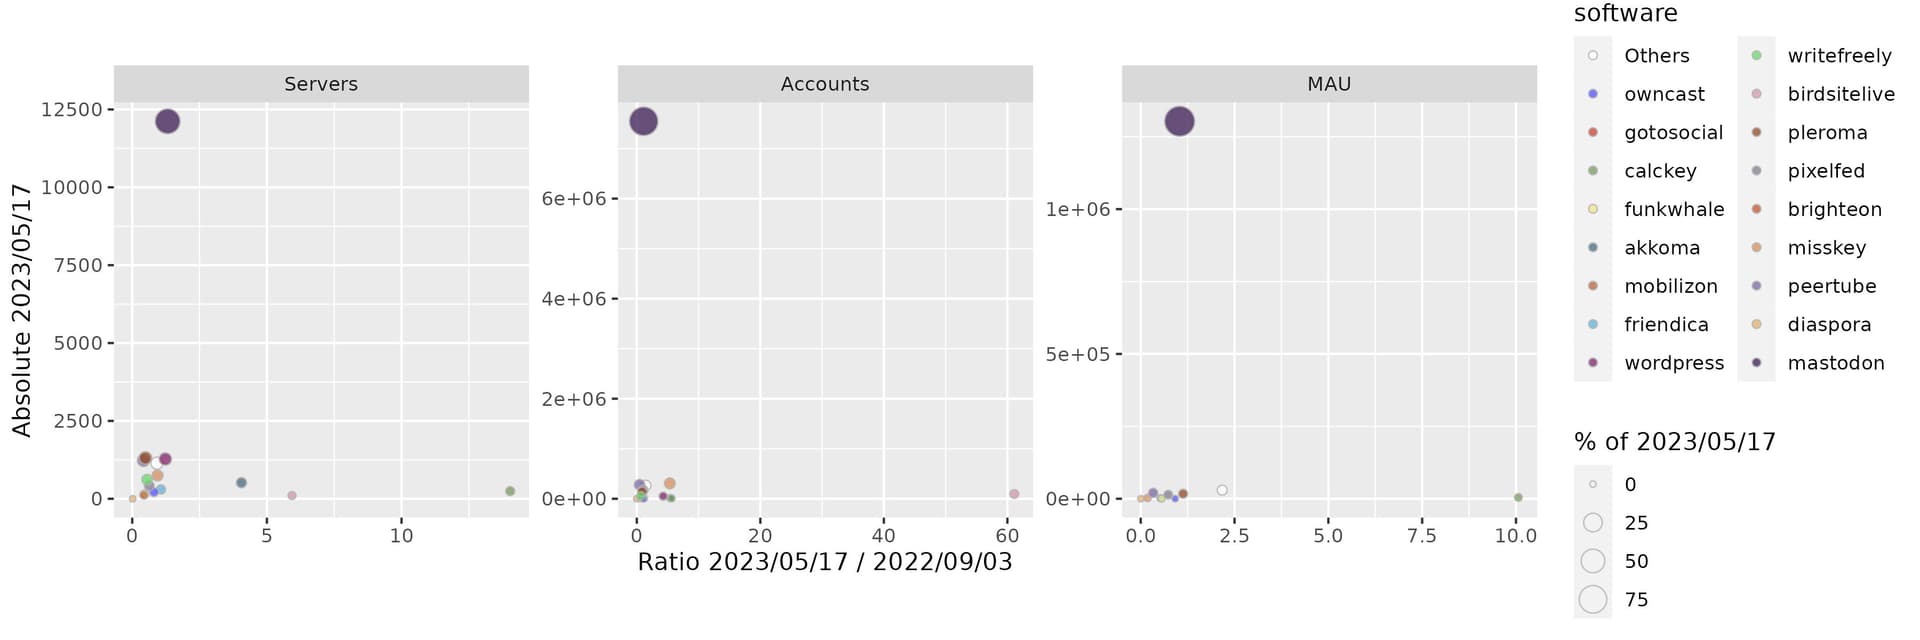
Despite still having a small amount servers, calckey, birdsitelive and akkoma show the highest growth in this measure. Birdsitelive also show a big growth in total accounts, while calckey is clearly growing in terms of active accounts.

Variation in global software diversity

Finally, I have applied the ecology indexes of diversity and evenness that I had used in the previous analysis but analyzing software distribution in this case.

Time ShannonIndex.Severs SimpsonIndex.Severs ShannonIndex.Accounts SimpsonIndex.Accounts ShannonIndex.Active SimpsonIndex.Active
2022/09/03 2.070341 0.7645023 1.0462905 0.4405626 0.5227572 0.1902811
2023/05/17 1.903229 0.6545103 0.9360958 0.3210791 0.4099790 0.1293983

In line with the increase in mastodon’s dominance of the Fediverse, all diversity measures are reduced within this 6 months.

Conclusions

As conclusions, we could say that the Fediverse is getting decentralized in terms of server distribution (first analysis) but, in contrast, software usage is becoming less diverse. It’s also relevant the loss of diaspora users and less clearly peertube users, and the big growth of calckey, birdsitelive and akkoma.

3 Likes