Hello!
Following a previous analysis (!it’s in catalan language!) and recovering the interest on the Fediverse, I’ve extended my analysis focusing in software diversity in that case.
The two time points analyzed are from September 2022 and May 2023. In the initial analysis above there is a mistake.
The dataset used is obtained using script based on this code written by @spla.
Before getting into the analysis itself, I want to state that the active users measure is somehow confusing. Some servers show higher amount of active users than total users! And the other servers may also have overestimating its activity. While it may have a technical explanation, it makes interpretation a bit more difficult.
Absolute dynamics by software
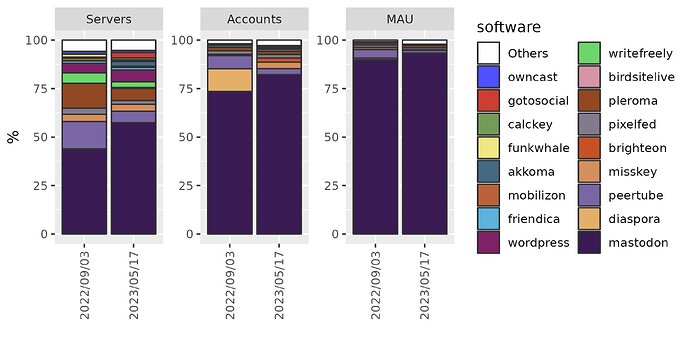
In this first plot, I represent the dynamics in terms of servers suing the software, absolute accounts of servers using it and active accounts on those servers. I’m showing any software reaching 1% in any of the three measures and the rest are grouped in the “Others” category (otherwise the amount would be overwhelming).
As it can be observed, there is a huge increase for mastodon software in the three measures. In May, there are 4 times the amount of servers using it there were in September 2022. And active accounts have increased 3 times!
The variation in other software is less evident, so I have excluded mastodon from the analysis in order to zoom on them.
From this results, more or less all software show an increase in the servers amount, specially wordpress, akkoma and also the Others category.
In terms of total accounts, misskey show a significant increase and we can see a decrease in peertube accounts and a big decrease for diaspora. This is due to the closing of the very big instance joindiaspora.com.
Focusing in active accounts, I highlight pleroma and pixelfed increase, in addition to the Others category.
Relative distribution of software
Next analysis represents the software distribution related to the three measures.
We can see that mastodon was the most used software in September, although it didn’t reach the 50%. This dominance has increased in the last 6 months becoming the majority of servers.
Mastodon dominance much clearer in terms of total and active accounts.
Software variation in relative distribution
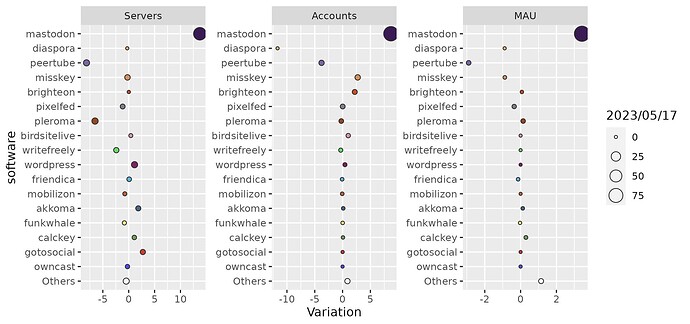
In order to visualize better the variation in each software contribution to the Fediverse I have plotted the difference in percentage between the two time points (x axis) by each software (y axis). Size of the points represent percentage in each measure in May time point.
As we could see in the previous plot, the increase in the amount of servers using mastodon is significantly higher than the rest, reaching a variation of more than 10%. In addition, gotosocial, akkoma, calckey, wordpress and birdsitelive also show an increase in percentage.
In terms of total accounts, misskey, brighteon and birdsitelive join mastodon in showing a positive variation. Diaspora and peertube have clearly step back in representation. The last also show a clear reduction in active accounts, where the active users not using any of the listed softwares stands up.
Software growth
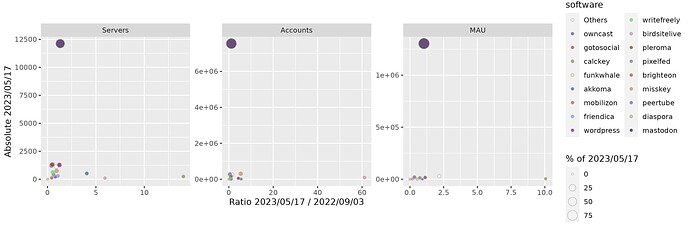
In order to focus in the increase taking the absolute values for the three measures I have plotted the Ratio between the two time points (x axis) versus the absolute measure in May (y axis). Point size represents the percentage in May.
Despite still having a small amount servers, calckey, birdsitelive and akkoma show the highest growth in this measure. Birdsitelive also show a big growth in total accounts, while calckey is clearly growing in terms of active accounts.
Variation in global software diversity
Finally, I have applied the ecology indexes of diversity and evenness that I had used in the previous analysis but analyzing software distribution in this case.
| Time | ShannonIndex.Severs | SimpsonIndex.Severs | ShannonIndex.Accounts | SimpsonIndex.Accounts | ShannonIndex.Active | SimpsonIndex.Active |
|---|---|---|---|---|---|---|
| 2022/09/03 | 2.070341 | 0.7645023 | 1.0462905 | 0.4405626 | 0.5227572 | 0.1902811 |
| 2023/05/17 | 1.903229 | 0.6545103 | 0.9360958 | 0.3210791 | 0.4099790 | 0.1293983 |
In line with the increase in mastodon’s dominance of the Fediverse, all diversity measures are reduced within this 6 months.
Conclusions
As conclusions, we could say that the Fediverse is getting decentralized in terms of server distribution (first analysis) but, in contrast, software usage is becoming less diverse. It’s also relevant the loss of diaspora users and less clearly peertube users, and the big growth of calckey, birdsitelive and akkoma.


